Run trace was first introduced in OllyDbg 1.04. This
debugging technique is basically very simple. Code is executed step by
step, and debugger protocols every command, together with registers and
flags, in the large circular buffer. When exception occurs, one can backtrace
several (or hundreds of thousands) last commands and analyse conditions
that led to error.
OllyDbg 1.06 has significantly improved the possibilities
of run trace. Run trace shows modified registers and keeps important messages
and operands of known functions. One can set conditions to pause run trace,
profile traced code, write run trace to disk in order to overcome memory
limitations or to compare two runs, debug self-modified programs, find
ount when command at certain location was executed for the last time, and
so on.
Please keep in mind, however, that run trace is slow. On a 500-MHz processor, OllyDbg can trace up to 2500 (Windows 95) or 5000 (NT) commands per second. To accelerate run trace, one can mark quasi-linear pieces of code (without jumps to outside) that should be executed at once. And one more limitation: OllyDbg doesn't save the contents of accessed memory.
To make you familiar with the run trace, let's try to debug a simple console application:
- #include <stdio.h>
- void f1(void) { printf("a"); };
- void f2(void) { printf("b"); };
- void f3(void) { printf("c"); };
- void (*f[3])() = { f1,f2,f3 };
- void main(void) {
- int i,j,k;
- for (i=0; i<100; i++) {
- for (j=0; j<1000000; j++) ; // Long code
- k=i/33;
- if (k>3) continue;
- f[k](); // Here error (when i==99)!
- };
- printf("\n");
- };
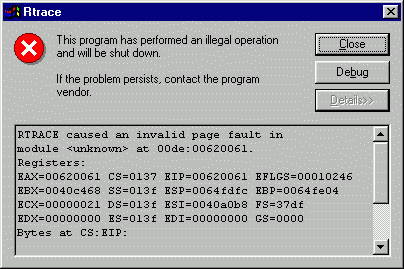
Oh, no! Something is definitely wrong! As OllyDbg is your just-in-time debugger of choice, you press "Debug", but Disassembler window is empty! Address 00620061 points to nowhere, and you have not the faintest idea which command jumped to this location. Let's try from the very beginning. Press Ctrl+F2 (shortcut for Restart), then Ctrl+F11 (Trace into) and wait for a minute or two. Console is still empty. Maybe some part of the code takes too long to execute? Pause run trace by pressing F12 (Pause) or Esc. In the Executable modules, click on RTRACE and select "View run trace profile":

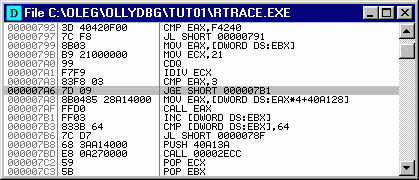
A command or a sequence of commands at address 00401191 was executed more than 24000 times. Follow this line in Disassembler:
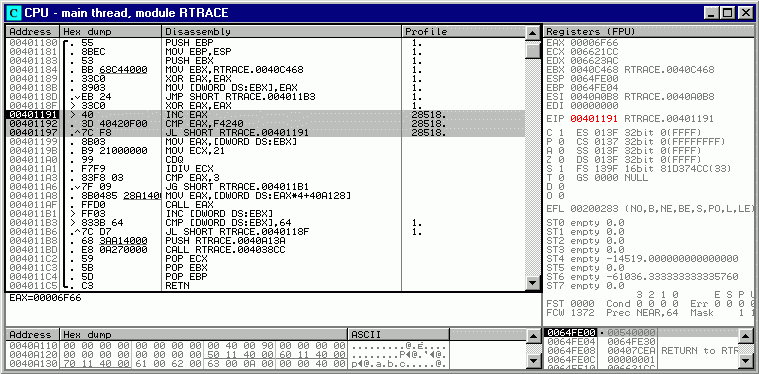
A short 3-command cycle executes F4240 (decimal 1000000)
times. At 5000 commands per second, OllyDbg will need 10 minutes to trace
this cycle. Note that sequence is quasi-linear, i.e. has no jumps to outside.
From the pop-up menu, choose "Run trace|Skip selection when tracing". Red
line in the fourth column indicates that commands are excluded from run
trace. When OllyDbg encounters excluded sequence, it sets temporary breakpoint
at the command that immediately follows excluded block (in our case, 00401199)
and runs it at once. Of course, any return or jump to outside would
make correct tracing impossible, so OllyDbg checks the piece of code you
want to exclude and in hard cases asks you for confirmation.
Continue run trace. The digits now appear quickly.
Within 20 seconds, OllyDbg reports error:

Confirm this error, open Run trace window (button with period '...' in the toolbar) and scroll it to the bottom:
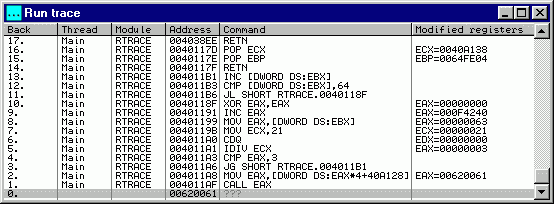
Now we can see that command that jumped to 00620061 was CALL EAX at 004011AF, and invalid address was calculated one command before the call. Doubleclick this line to see it in Disassembler. Registers and information are grayed to emphasize that they are not actual, but taken from the trace:
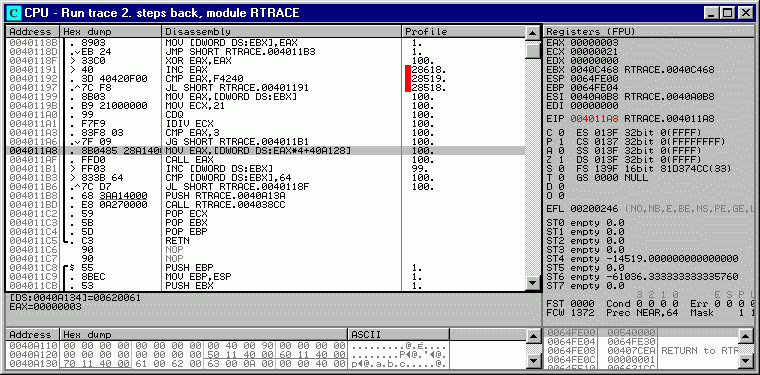
Address constant 0040A128 points to array of 3 fixups containing addresses of functions f1, f2 and f3. When this command was executed for the last time, EAX contained index 3, outside the array's bounds. Two previous commands should perform bounds checking, but condition is invalid: jump is taken when EAX is greater than 3. Correct condition would be "greater or equal". Doubleclick invalid line and correct condition:

After you assemble new command, line in Disassembler gets red, indicating that command is modified. Select it again and in the pop-up menu choose the powerful item "Copy to executable file". This applies your modification directly to the executable file:
All you need is to save modified executable (under
different name, of course) and check it. Now the program works correctly!
It was easy, isn't it?..
You can download this tutorial and sample program
rtrace.exe here.